
Monitoring of Electroencephalogram (EEG) signal for different lobes.
THE NERVOUS SYSTEM
The task of controlling the various functions of the body and coor¬dinating them into an integrated living organism is not simple. Conse¬quently, the nervous system, which is responsible for this task, is the most complex of all systems in the body. It is also one of the most interest¬ing. Composed of the brain, numerous sensing devices, and a high-speed communication network that links all parts of the body, the nervous sys¬tem not only influences all the other systems but is also responsible for the behavior of the organism. In this broad sense, behavior includes the ability to learn, remember, acquire a personality, and interact with its socie¬ty and the environment. It is through the nervous system that the organism achieves autonomy and acquires the various traits that characterize it as an individual.
ANATOMY OF THE NERVOUS SYSTEM
The basic unit of the nervous system is the neuron. A neuron is a single cell with a cell body, sometimes called the soma, one or more “input” fibers called dendrites, and a long transmitting fiber called the axon. The portion of the axon immediately adjacent to the cell body is called the axon hillock. Both axons and dendrites are called nerve fibers, and a bundle of individual nerve fibers is called a nerve. Nerves that carry sensory information from the various parts of the body to the brain are called afferent nerves, whereas those that carry signals from the brain to operate various muscles are called efferent nerves.
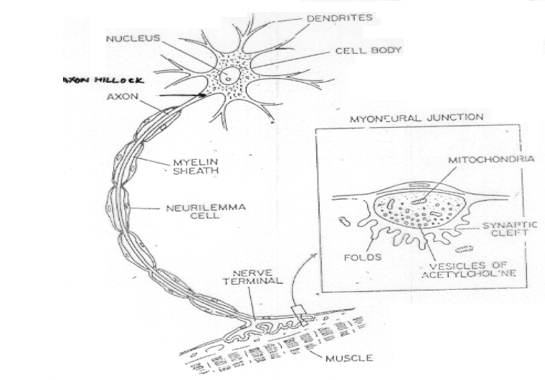
Figure-1: Nerve cell and connection to muscle.
The brain is an enlarged collection of cell bodies and fibers located inside the skull, where it is well protected from light as well as from physical, chemical, or temperature shock. At its lower end, the brain is connects with the spinal cord, which also consists of many cell bodies and fiber bundles. Together the brain and spinal cord comprise one of the main divisions of the nervous system, the central nervous system (CNS). In addition to a large number of neurons of many varieties, the central nervous system also con¬tains a number of large fatty cell bodies called glial cells. About half the brain is composed of glial cells.
Cell bodies and small fibers in fresh brain are grey in color and are called grey matter, whereas the myelin coating of larger fibers has a white appearance, so that a collection of these fibers is referred to as white matter.
Collections of neuronal cell bodies within the central nervous system are called nuclei, while similar collections outside the central nervous system are called ganglia.
Nerve fibers outside the central nervous system are called peripheral nerves. This name applies even to fibers from neurons whose cell bodies are contained within the central nervous system. Throughout most of their length, many peripheral nerves are mixed, in that they contain both afferent and efferent fibers. Afferent peripheral nerves that bring sensory informa¬tion into the central nervous system are called sensory nerves, whereas ef¬ferent nerves that control the motor functions of muscles are called motor nerves. Peripheral nerves leave the spinal cord at different levels, and the nerves that innervate a given level of body structures come from a given level of the spinal cord.
The peripheral nervous system actually consists of several subsystems. The system of afferent nerves that carry sensory information from the sensors on the skin to the brain is called the somatic sensory nervous system. Visual pathways carry sensory information from the eyes to the brain, whereas the auditory nervous system carries information from the auditory sensors in the ears to the brain. Fig.2 shows a side view of the brain and spinal cord, and Fig.3 is a cutaway showing some of the major structures.
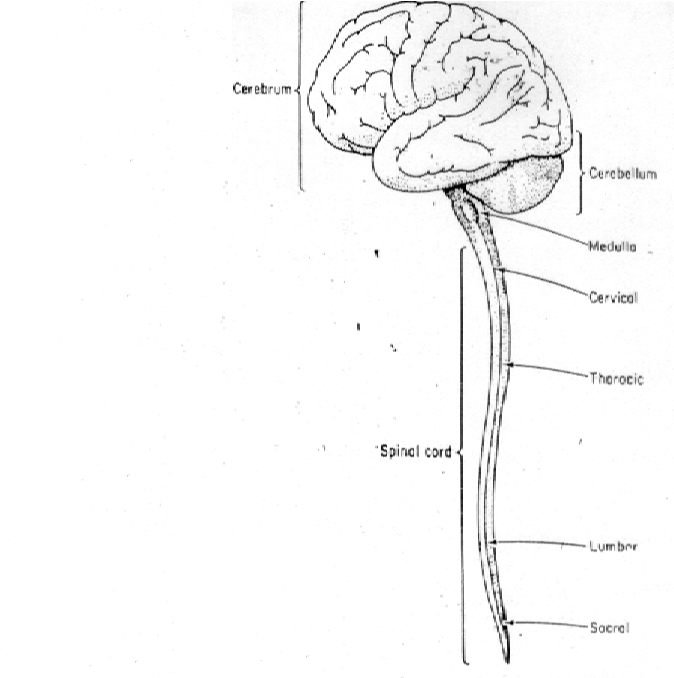
Figure-2: The brain and spinal cord.
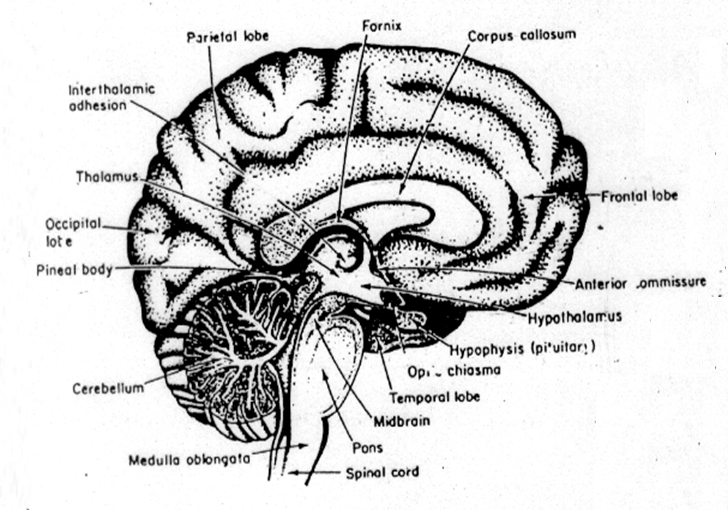
Figure-3: Cutaway section of the human brain.
HUMAN BRAIN
The human brain is an amazing three-pound organ that controls all functions of the body, interprets information from the outside world, and embodies the essence of the mind and soul. Intelligence, creativity, emotion, and memory are a few of the many things governed by the brain. Protected within the skull, the brain is composed of the cerebrum, cerebellum, and brainstem. The brain receives information through our five senses: sight, smell, touch, taste, and hearing - often many at one time. It assembles the messages in a way that has meaning for us, and can store that information in our memory. The brain controls our thoughts, memory and speech, movement of the arms and legs, and the function of many organs within our body.
BRAIN REGIONS
The brain is composed of the cerebrum, cerebellum, and brainstem (Fig. 4).The brain directs our body’s internal functions. It also integrates sensory impulses and information to form perceptions, thoughts, and memories. The brain gives us self-awareness and the ability to speak and move in the world. Its four major regions make this possible: The cerebrum, with its cerebral cortex, gives us conscious control of our actions. The diencephalon mediates sensations, manages emotions, and commands whole internal systems. The cerebellum adjusts body movements, speech coordination, and balance, while the brain stem relays signals from the spinal cord and directs basic internal functions and reflexes.
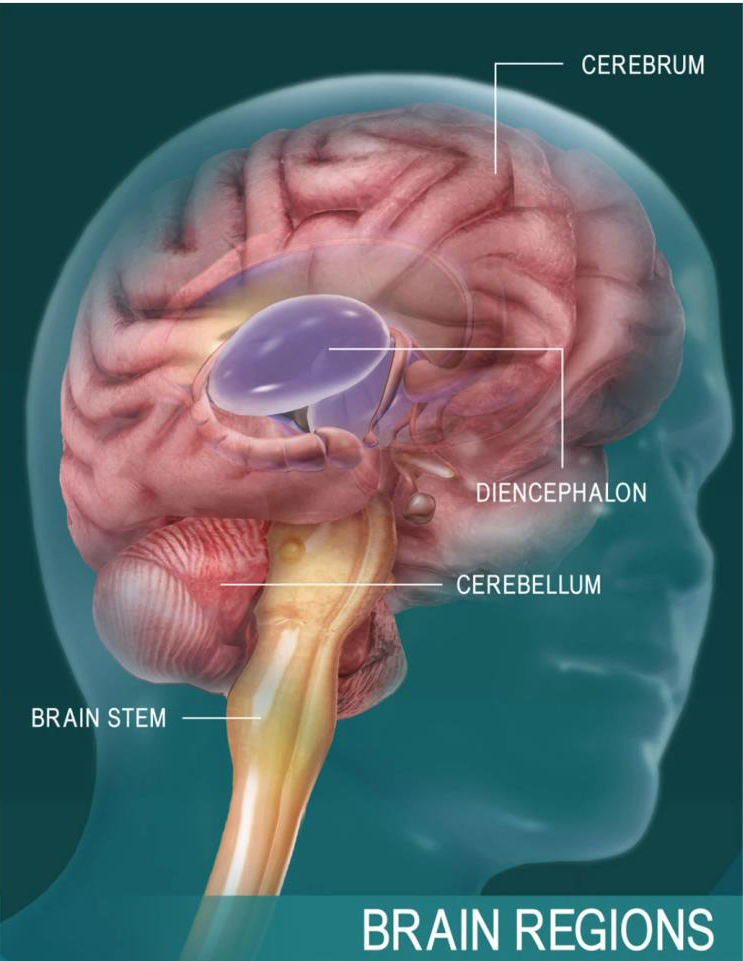
Figure-4: Brain regions.
CEREBRUM
The cerebrum is the largest brain structure and part of the forebrain (or prosencephalon) (Fig.2). Its prominent outer portion, the cerebral cortex, not only processes sensory and motor information but enables consciousness, our ability to consider ourselves and the outside world. It is what most people think of when they hear the term “grey matter”. The cortex tissue consists mainly of neuron cell bodies, and its folds and fissures (known as gyri and sulci) give the cerebrum its trademark rumpled surface. The cerebral cortex has a left and a right hemisphere. Each hemisphere can be divided into four lobes: the frontal lobes, temporal lobes, occipital lobes, and parietal lobe. The lobes are functional segments. They specialize in various areas of thought and memory, of planning and decision making, and of speech and sense perception.
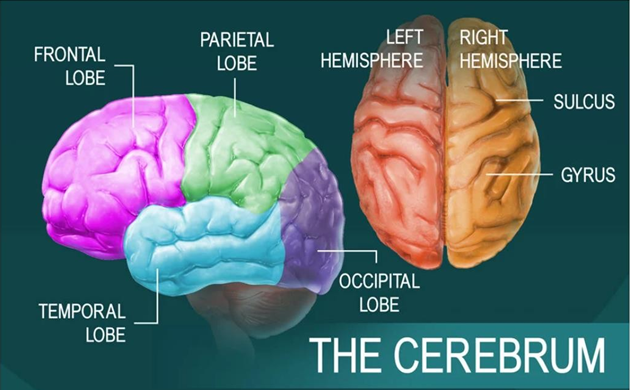
Figure-5: The Cerebrum.
CEREBELLUM
The cerebellum is the second largest part of the brain (Fig.5). It sits below the posterior (occipital) lobes of the cerebrum and behind the brain stem, as part of the hindbrain. Like the cerebrum, the cerebellum has left and right hemisphere. A middle region, the vermis, connects them. Within the interior tissue rises a central white stem, called the arbor vitae because it spreads branches and sub-branches through the hemispheres. The primary function of the cerebellum is to maintain posture and balance. When we jump to the side, reach forward, or turn suddenly, it subconsciously evaluates each movement. The cerebellum then send signals to the cerebrum, indicating muscle movements that will adjust our position to keep us steady.
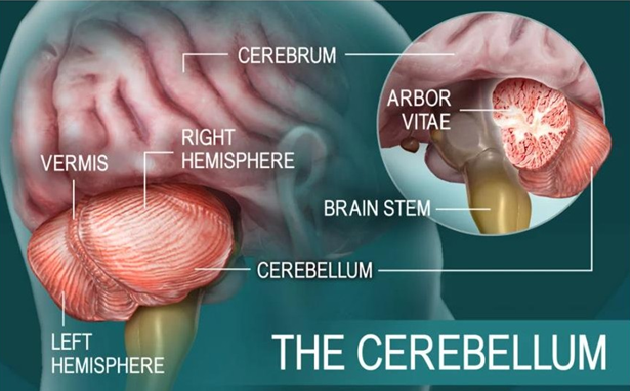
Figure-6: The Cerebellum.
BRAINSTEM
The cerebral hemispheres have distinct fissures, which divide the brain into lobes. Each hemisphere has 4 lobes: frontal, temporal, parietal, and occipital. Each lobe may be divided, once again, into areas that serve very specific functions. It’s important to understand that each lobe of the brain does not function alone. There are very complex relationships between the lobes of the brain and between the right and left hemispheres (Fig.7).
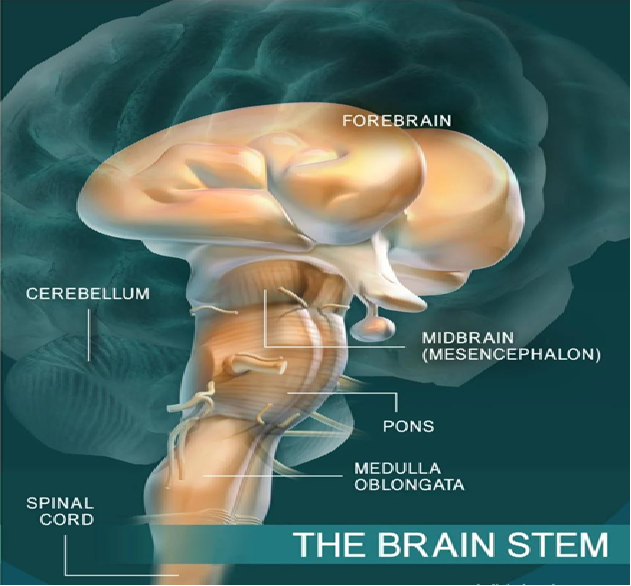
Figure-7: The Brainstem.
LOBES OF THE BRAIN
Brainstem acts as a relay center connecting the cerebrum and cerebellum to the spinal cord (Fig.6). It performs many automatic functions such as breathing, heart rate, body temperature, wake and sleep cycles, digestion, sneezing, coughing, vomiting, and swallowing. The brain stem connects the spinal cord to the higher-thinking centers of the brain. It consists of three structures: the medulla oblongata, the pons, and the midbrain. The medulla oblongata is continuous with the spinal cord and connects to the pons above. Both the medulla and the pons are considered part of the hindbrain. The midbrain, or mesencephalon, connects the pons to the diencephalon and forebrain. Besides relaying sensory and motor signals, the structures of the brain stem direct involuntary functions. The pons helps control breathing rhythms. The medulla handles respiration, digestion, and circulation, and reflexes such as swallowing, coughing, and sneezing. The midbrain contributes to motor control, vision, and hearing, as well as vision- and hearing-related reflexes.
Frontal lobe• Personality, behavior, emotions
• Judgment, planning, problem solving
• Speech: speaking and writing (Broca’s area)
• Body movement (motor strip)
• Intelligence, concentration, self-awareness
Parietal lobe
• Interprets language, words
• Sense of touch, pain, temperature (sensory strip)
• Interprets vision, hearing, sensory and memory
• Spatial and visual perception
Occipital lobe
• Interprets vision (color, light, movement)
Temporal lobe
• Understanding language (wernicke’s area)
• Memory
• Hearing
• Sequencing and organization
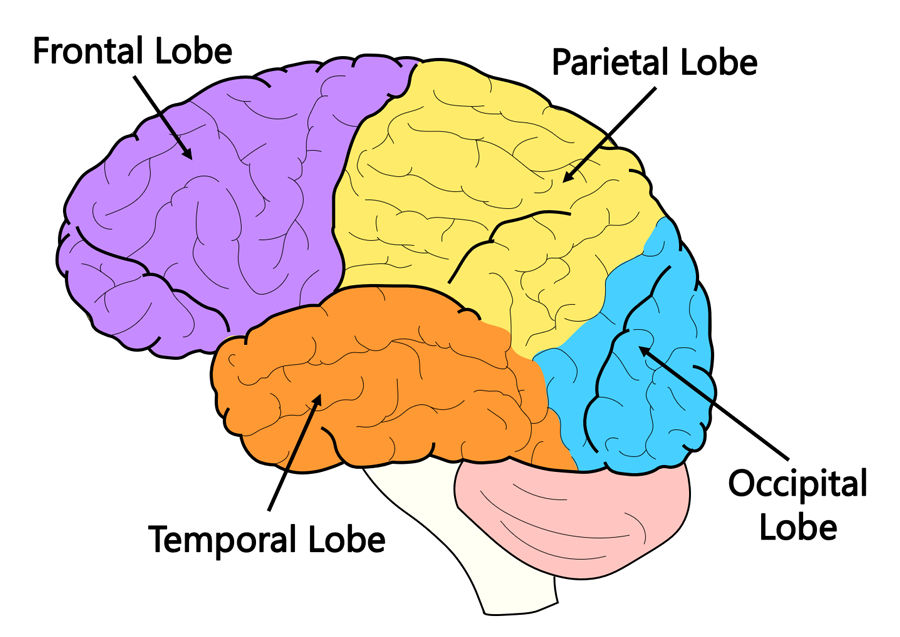
Figure-8: Lobes of the brain.
EEG SIGNALS
The EEG signal that arises on the scalp is measured as a voltage in the time domain, with a wide number of potential signal morphologies present. Fig.8 shows some example waveforms. In general, the EEG is not a nice looking signal. To the untrained eye, it often looks only like noise, and it takes significant experience for a human to be able to interpret anything beyond the coarse features that are present. These features can be classified in multiple ways, with different methods being common depending on the field of application. Very common is to divide the EEG into free-running, evoked and hybrid components.
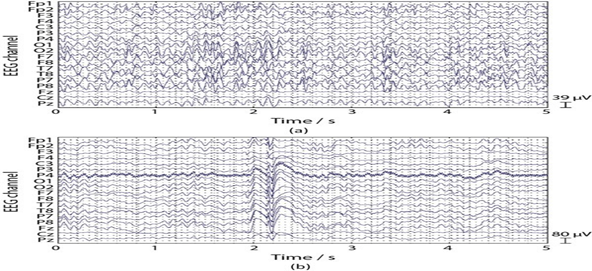
Figure-9: Examples of EEG Waveforms (a) Free-running background EEG. (b) An interictal spike.
Free-running EEG is the brain activity that is present due to the normal operation of the brain. It is there, all of the time, as the brain is operating. This EEG is characterized by diving it into frequency bands, each given the name of a Greek letter:
• Delta: Activity at less than 4 Hz
• Theta: Activity between 4 and 8 Hz
• Alpha: Activity between 8 and 13 Hz
• Beta: Activity between 13 and 30 Hz
• Gamma: Activity over 30 Hz
An example of a single EEG trace broken down into these frequency bands is shown in Fig.9, which illustrates how the different bands evolve over time.
An increase or decrease in the power present in a particular band at any point in time is then an indicator of the user’s state. For example, when a user is restful and closes their eyes, a dominant alpha rhythm emerges at the back of the head over the occipital cortex. This is easily identified and is a common test used to check that the EEG is set up correctly. Alternatively, the process of falling asleep is associated with alpha activity being replaced by slower theta activity. Many applications of EEG are based, at least in part, upon the tracking of these frequency bands over time. Note that it is near universal to divide the EEG spectrum into these bands, but some EEG disciplines use slightly different frequency ranges as the split points. Care should be taken to adhere to the standard practice in the precise application area.
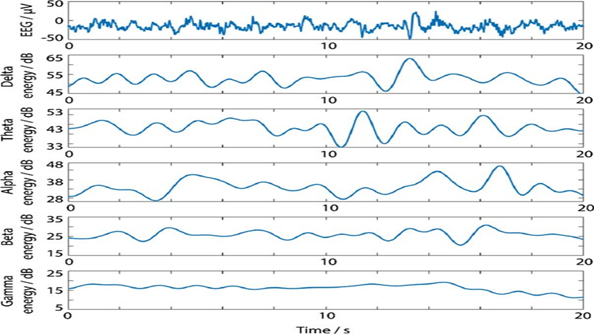
Figure-10: EEG Channel broken down into frequency bands.
Within free-running EEG there are then a number of features that occur due to different brain states which will be of interest for different applications. For example, Fig.6 (b) shows an interictal spike, which is a characteristic feature of epilepsy and can be used to help locate the epileptic foci within the brain. Focusing on epilepsy, a number of similar features can be identified:
• Spike: The spike is a classic example of epileptic activity, and its presence is useful for determining the focus of the epilepsy. Spikes are defined as “transients, clearly distinguished from background activity with a duration from 20 to under 70 ms.”
• Sharp wave: Sharp waves are similar to spikes but with a duration between 70 and 200 ms. And generally they are of less interest when interpreting EEGs as they provide less localizing information.
• Spike-and-wave (spike-and-slow-wave): Here a spike is followed by a wave which has a duration of more than 125 ms.
Similar features can be identified for other medical conditions and brain states, most noticeably sleep analyses which are based upon identifying:
• Slow oscillations: A clear sub 1 Hz oscillation with negative going state, followed by an upwards going state that lasts for several hundred milliseconds.
• Sleep spindles: “A burst at 11–15 Hz but mostly at 12–14 Hz generally diffuse but of high voltage over the central regions”. Generally split into fast and slow spindles depending on the peak frequency.
• K-complexes: “A high voltage negative slow wave followed by a smaller positive slow wave frequency associated with a sleep spindle”. Noted to be variable in appearance and not due to external stimuli.
In contrast to free-running EEG, evoked EEG arises due to stimuli being presented to the user. For example, if a user concentrates on a flashing light at a particular frequency, that stimulus produces a steady-state visual-evoked potential (SSVEP). That is, an oscillation at the same frequency as the light source arises in the EEG at the back of the head. Similar steady-state responses can be found due to audio stimuli, in which case they are termed auditory steady-state responses (ASSR). These evoked responses form the fundamental basis of many brain– computer interfaces (BCIs). For example, if a screen has multiple light sources, each at a different frequency, it is possible to tell which source the user is focusing on as this will be the frequency of the resulting SSVEP. This information can then be used to control a cursor moving around the screen or to make a decision.
There are in fact a very wide number of evoked responses that are possible due to different forms of stimuli and experimental set ups. In addition to steady-state responses, also common are event-related potentials (ERPs) which arise due to the presentation of individual stimuli, with a gap present before a subsequent stimuli presentation. Below are some common ERPs:
• P100: elicited by using checkerboard (alternating black and white) stimulation.
• N100: produced by the presence of an unexpected stimulus, particularly auditory, when no other task is being performed.
• N170: elicited when a face is present in visual stimuli.
• P300: produced by an oddball stimulation.
• N400: produced in response to the recognition of a face.
All of these are named P, for a positive going deflection, or N, for a negative going deflection, together with a number which reflects approximately how long after the presentation of the stimuli the response is evoked (in milliseconds).
Not all of the possible ERPs will be present in every experiment, and the range of choices available gives a great deal of freedom for investigating different uses of EEG as a tool for understanding the brain (the precise shape/timing of ERPs is modulated by the current brain state) and for making BCIs. Fig.10 shows an example of evoked responses produced during a face detection task where the user was shown a series of pictures for 1 s, followed by 1 s pauses, with the picture randomly selected to be a recognizable face or static noise. A number of evoked responses can be seen. Here P100, N170 and P300 responses are present.
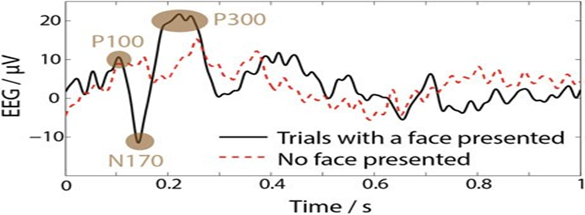
Figure-11: Averaged evoked responses with face presented and no face presented.
The last class of data, hybrid EEG, is between the above two cases. No direct stimuli are presented to the user, but they are asked to think of something or imagine performing an action. This can then result in known signal morphologies arising in the EEG. The best known such signal is associated with motor imagery: when a user is asked to imagine performing a hand movement, EEG activity at 8–12 and 18–26 Hz decreases over the motor cortex (around electrode positions C3 and C4), and there is an event-related desynchronization. This is illustrated in Fig.11 which shows the event-related desynchronization associated with imagined left and right hand movements on the different sides of the head. This and similar hybrid tasks form the basis of many BCIs.
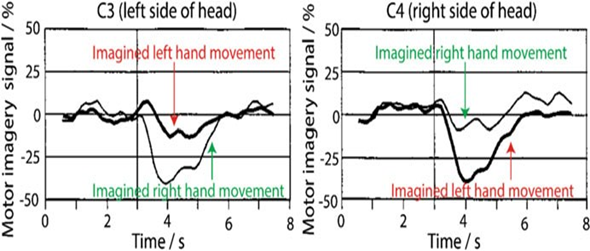
Figure-12: Event-related desynchronization associated with imagined left and right hand movements on different side of the head.
MEASUREMENT OF EEG SIGNALS
ELECTRICAL ACTIVITY OF THE BRAIN
• During the electrical activity neuronal signal generated in the brain. These signals are classified as:-
- EEG (Electroencephalogram) – Continuous record of brains spontaneous electrical activity.
- ERP or EP (Event Related Potential or Evoked Potential) – Electrical response of the brain due to specific stimulus.
• Electrical potentials of the brain are recorded by scalp electrode (Disk type surface electrode).
• Cerebral cortex (Fig.12) is the region where the neuronal signals in response to stimulus can be observed.
• Receives sensory information from skin, eyes, ears and other receptors.
• Superior part of temporal lobe contains primary auditory cortex which receives auditory receptors in the inner ear.
• The occipital lobe at the back of head is primary visual cortex. Light flashed into the eye evokes large electrical potentials from electrodes placed over this area of the cortex.
• Precentral gyrus functions as primary motor cortex. From this gyrus, nerve signals run down through the brain stem to the spinal cord for control of skeletal muscles via neural control of motor neurons in spinal cord.
• Premotor cortex is associated with motor movements related to speech or hearing.
• The frontal lobe is involved in control of emotional behavior.
• Primary somatosensory cortex (Post central gyrus) receives impulses from general sense receptors from skin (e.g. pressure, touch and pain receptors).
• Each little area along this gyrus is related to a particular part of body. Area depends upon number of sensory nerves.
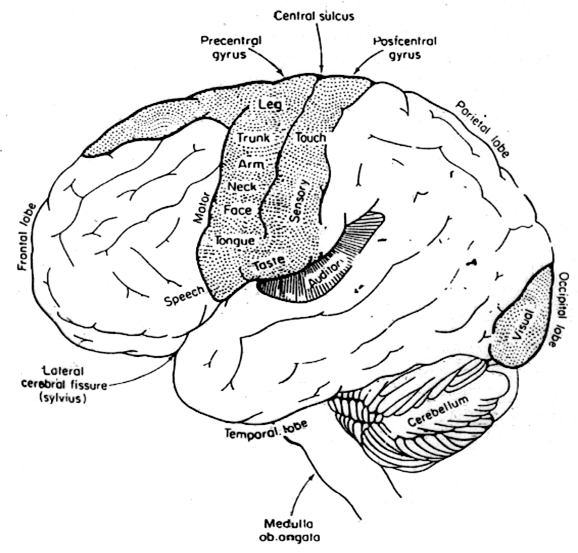
Figure-13: The cerebral cortex.
RECORDING OF EEG SIGNAL AND PLACEMENT OF ELECTRODES
• EEG can be recorded by three types of electrodes:-
- 1. EEG ------- Scalp ----- Outer Surface ( Over Scalp )
- 2. ECoG ------ Cortical ---- Exposed Surface
- 3. Depth Records ----- Depth ---- In Deep Brain
• EEG can be recorded in two modes (Fig.13):-
- 1. Unipolar (Monopolar)
- 2. Bipolar
• In EEG electrodes are placed in 10-20 electrode system (Fig.14):-
- a. They are designated on the basis of their location in particular lobe.
- b. Position is based on distance between Nasion to Inion i.e. from front to back and distance between two ear lobes.
- c. In all there are 21 electrodes:- 19 active electrodes and 2 reference electrodes-
- Prefrontal: Fp1, Fp2
- Frontal: Fz, F3, F4, F7, F8
- Central: Cz, C3, C4
- Occipital: O1, O2
- Ear lobes: A1, A2
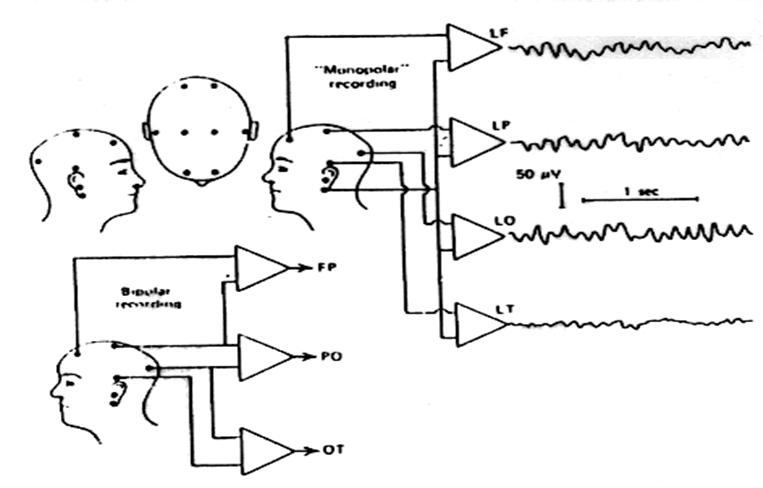
Figure-14: Method of connecting the recording channels for “Monopolar” and “Bipolar” recording.
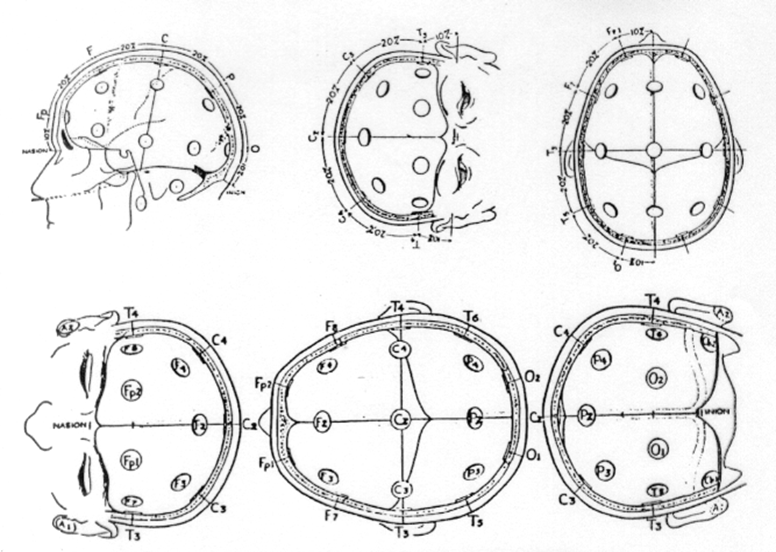
Figure-15: The 10–20 electrode system recommended by the international federation of EEG scientists.
BASIC SET UP
Typical signals detected by scalp-mounted electrodes are in the range 1–150 μV over a 0.1–60 Hz bandwidth, although some higher frequency content may also be present. The signals vary both temporally and spatially, and so multiple electrodes are typically used. Electrode positions are determined using the 10–20 standard, so named as distances between electrodes are measured as being 10% or 20% of the skull dimensions, as illustrated in Fig.15. Electrode letters correspond to their position on the skull, with odd number electrodes being on the left hemisphere and even ones on the right. A 10% system is described in and can be used in situations when further electrode positions are required to get more coverage over the head. Smaller subdivisions are also possible for when a very large number of electrodes are used.
A pair of electrodes is required in order to obtain a voltage potential difference, and each pair of electrodes is thus connected to an amplifier. After suitable amplification and bandwidth limiting, the signals are stored in a suitable location. In older devices an analog signal was stored on a magnetic tape or written out by a pen writer. Modern devices digitize the signals allowing them to be stored, wirelessly transmitted or analyzed in real time as desired for the particular application.
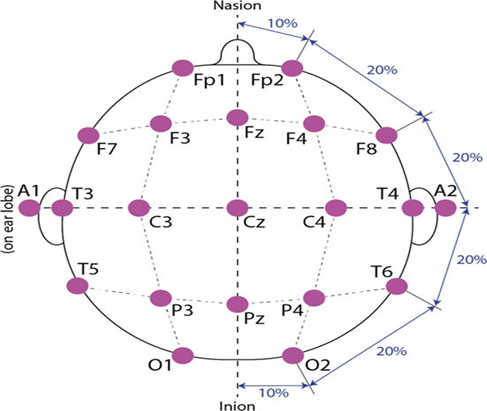
Figure-16: Front View of standard 10–20 electrode system for electrode placement and names.
PRACTICAL SET UP
Although a wide range of choices are available when performing a modern EEG recording, the conventional set up that first comes to mind when discussing the EEG is shown in Fig. 11(a). This illustrates a user with a head cap on which has holes to hold a number of electrodes next to the scalp. Each electrode has a long wire which allows it to be connected to recording instrument. On each electrode a conductive gel is placed in order to ensure that a good contact is made between the metal of the electrode and the scalp, and a close-up view of this is shown in Fig.11 (b). In conventional EEG this gel is critical to getting a good electrical contact with the head, and it can act as a mechanical buffer to ensure that the connection is maintained even during and after head movements.
 EEG set up with metal electrodes on the scalp (b) Electrode making contact with skin via gel.png)
Figure-17: – (a) EEG set up with metal electrodes on the scalp (b) Electrode making contact with skin via gel.